08 Mar Learning about Statistics and Data in Ms Mather’s Y6 Maths Group!
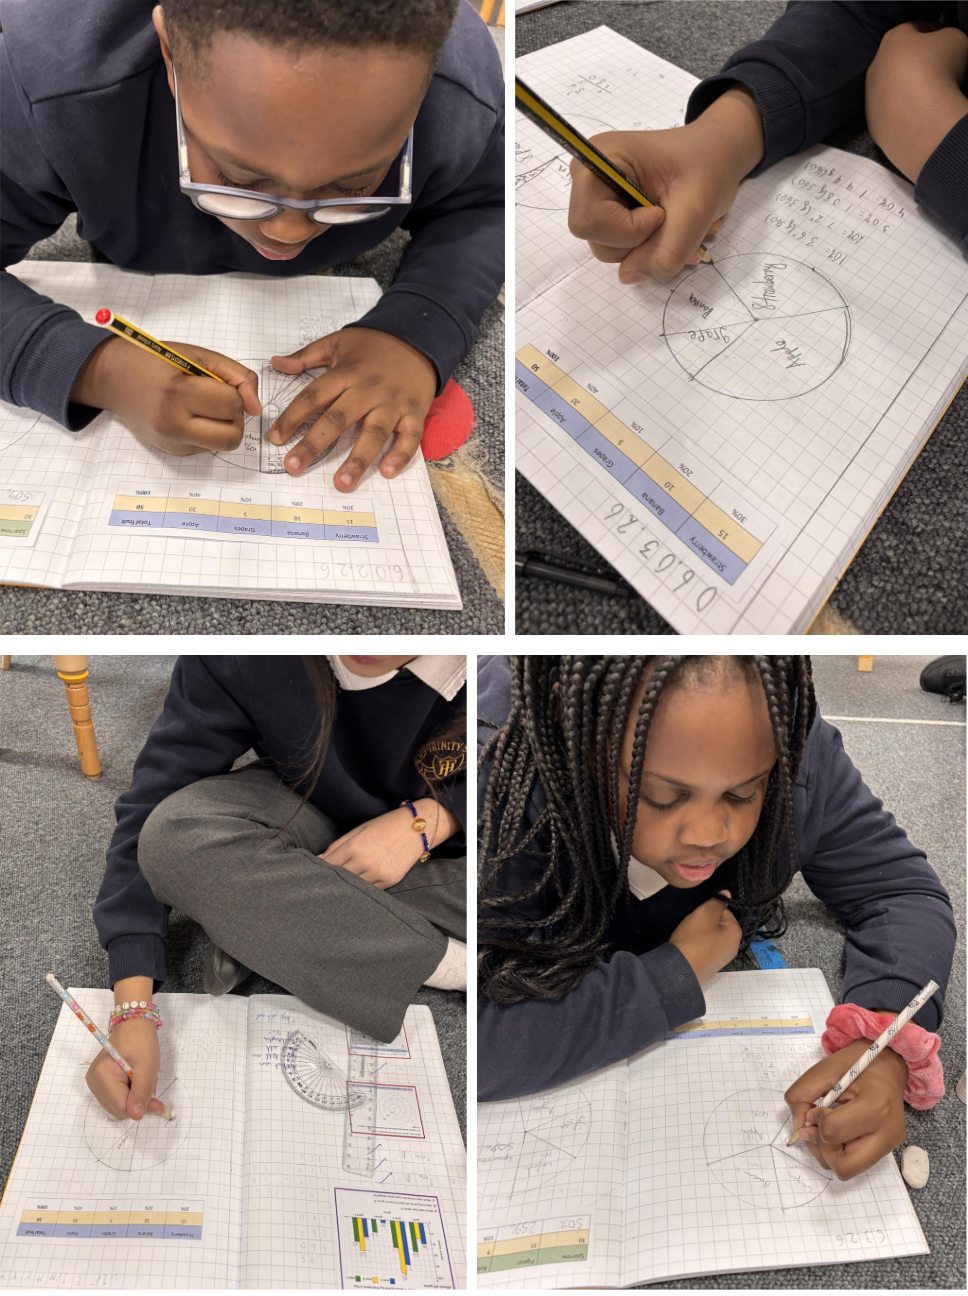
Year 6 pupils in Ms Mather’s maths group have, this week, been learning about statistics and data. Having looked and revised strategies for reading data across a range of representations (such as bar charts, line graphs, pictograms and tables) we then moved on to study pie charts. We began by constructing our own pie charts, understanding that a full turn is 360 degrees and then dividing this up to find percentage values (i.e. 10% of a full turn is 36 degrees, 25% of a full turn is 90 degrees, etc). We then used our protractors to plot out the correct turns to draw out and represent a range of data in our own pie charts.